This project focuses on the data analysis of the NY Stock Exchange data, finding insights, develop a dashboard for a profit and loss statement, and creating a financial forecasting model using three different scenarios.
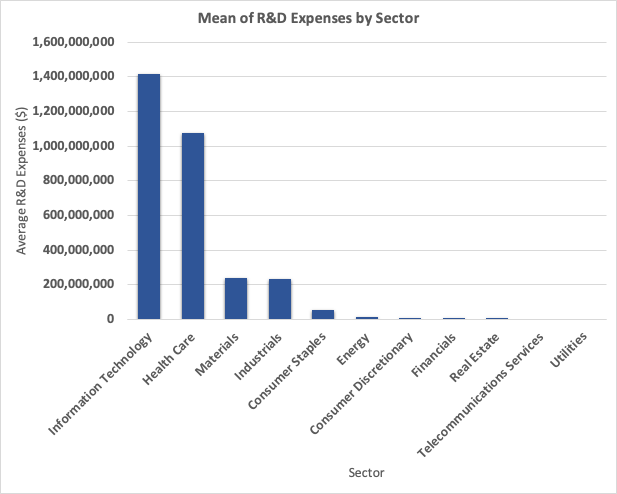
Mean of R&D Expenses by Sector
There is a big variability in the average R&D expenses among sectors, ranging from $0 to $1,413,211,465 with a standard deviation of $492,456,685.
Information Technology and Health Care are by far the sectors that have spent the most, each with over a $1B on average.
At the other end of the spectrum, sectors like Telecommunications Services and Utilities have not spent significantly in R&D.
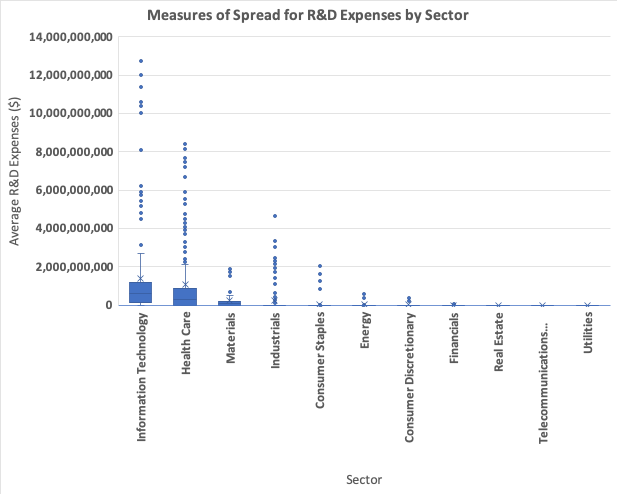
Measures of Spread for R&D Expenses by Sector
With this view, we can see that the average spent on Information Technology is pushed up by the presence of some extreme outliers. The mean is $1,413,211,465 but 50% of the companies in this sector spent $607,550,000 or less, which is the median. The standard deviation is $2,506,347,817 hence the values are greatly spread out.
Financial Forecasting Model
The following is a financial model for each company that forecasts out the Gross Profit, Operating Profit or EBIT for two more years using three scenarios (Best case, Weak case, Base case).
The information utilized in this project is derived from a subset of an extensive dataset offered by Kaggle, containing historical financial data from companies within the S&P 500.